
NPS, CSAT, and CES show up constantly for a reason: each one is a single, well-tested question with a known scoring method, which makes all three fast to field, easy to drop into any survey without much design work, and - because so many companies ask the same question worded the same way - easy to benchmark and trend over time in a way a custom-written satisfaction question never quite is. Our guide to survey metrics by industry covers what to reach for once your field has its own validated instrument - Gallup's Q12 for employee engagement, CAHPS for patient experience, and so on. This guide covers the three general-purpose ones that work as a reasonable default anywhere a field-specific standard doesn't exist, or as a starting point before you know enough about your situation to need one.
They aren't interchangeable, though - each measures a genuinely different thing, and reaching for the wrong one gets you a clean, confident number that answers the wrong question.
Table of Contents
- Net Promoter Score (NPS)
- Customer Satisfaction Score (CSAT)
- Customer Effort Score (CES)
- Choosing Between Them
- Setting One Up in Opionate
- Reading Your Results
- FAQ
Net Promoter Score (NPS)
Fred Reichheld introduced NPS at Bain & Company in a 2003 Harvard Business Review article called "The One Number You Need to Grow," built around a specific, well-documented finding: "how likely are you to recommend us" predicted business growth more reliably than the longer, more complicated satisfaction surveys companies were running at the time.
The question: "How likely are you to recommend [Company/Product] to a friend or colleague?" on a 0-to-10 scale.
Scoring: Respondents who answer 9 or 10 are promoters, 7 or 8 are passives, and 0 through 6 are detractors. The score is the percentage of promoters minus the percentage of detractors, which can range from -100 to +100 - a positive score simply means you have more promoters than detractors, nothing more precise than that on its own.
What it actually measures: Overall relationship sentiment, not satisfaction with any single interaction - closer to "do you feel good enough about this relationship to put your own reputation behind recommending it" than "how did that specific support ticket go." That makes it a strong metric to track over time at the relationship level, and a poor fit for judging one isolated touchpoint.
For how to actually analyze a moving NPS score rather than just watch it, see NPS Analysis: Beyond the Score.
Customer Satisfaction Score (CSAT)
CSAT doesn't have a single named origin the way NPS and CES do - it's closer to a measurement convention that emerged across customer service and market research practice over decades than one researcher's specific contribution, which is also why its exact wording and scale vary more from company to company than the other two.
The question: Some version of "How satisfied were you with [the product / this interaction / your recent purchase]?" - most commonly on a 1-to-5 scale (very dissatisfied to very satisfied), though a 1-to-7 or 1-to-10 scale shows up often enough to be worth checking before you compare your own number against a published benchmark.
Scoring: Typically reported as the percentage of respondents who answered in the top two boxes of the scale (4 or 5 on a 1-5 scale) - "percent satisfied" - rather than a raw average, since a top-box percentage is easier to communicate and track than a mean that can hide a bimodal split between very happy and very unhappy respondents.
What it actually measures: Satisfaction with a specific, recent interaction or transaction - a support call, a single purchase, a particular feature - which makes it the right tool for "was this specific thing good," not for the broader relationship question NPS is built to answer. Fielding a CSAT question immediately after the interaction it's asking about, rather than weeks later in a general survey, is what keeps the answer tied to the actual experience instead of a vaguer, averaged-out impression.
Customer Effort Score (CES)
Matthew Dixon, Karen Freeman, and Nicholas Toman introduced CES in a 2010 Harvard Business Review piece called "Stop Trying to Delight Your Customers," built on research across more than 75,000 customer interactions at the Corporate Executive Board (now part of Gartner). The underlying finding cuts against a lot of conventional service wisdom: companies don't get rewarded for exceeding expectations or delighting customers nearly as much as they get punished for making something effortful.
The question: "The company made it easy for me to handle my issue," rated from strongly disagree to strongly agree. That specific wording isn't arbitrary - the original research tested it against several alternative phrasings and found it roughly 25% more predictive of future loyalty than the next-best version, which is why it's worth using close to verbatim rather than a looser "how much effort did that take" rewrite.
Scoring: Typically reported as a mean score on the agreement scale, or as a percentage who agreed or strongly agreed.
What it actually measures: Friction in a specific process - getting a question answered, resolving an issue, completing a task - independent of how the interaction made someone feel. A customer can be unhappy about needing to contact support at all and still report low effort once they did; CES is measuring the mechanics of the interaction, not the respondent's broader sentiment about having needed it.
Choosing Between Them
A practical way to decide: NPS for the overall relationship, tracked over time, when you want a single trackable signal of whether people feel good enough about you to vouch for you. CSAT for a specific, recent interaction or transaction, when you want to know whether that one thing went well. CES for a specific process someone just completed, when the real question is how much friction it took rather than how they felt about needing to do it at all.
It's common to run more than one, asked at different points: a CES question right after a support interaction closes, a CSAT question after a purchase completes, and an NPS question on a slower cadence - quarterly or twice a year - to track the overall relationship rather than any single touchpoint. Running all three on the same cadence, asked about the same moment, usually just produces three closely correlated numbers instead of three genuinely different signals.
Setting One Up in Opionate
All three are a Rating Scale question - set the minimum and maximum to match the scale you're using (0-10 for NPS, typically 1-5 for CSAT, 1-5 or 1-7 for CES), and label both endpoints with the actual wording respondents will see rather than leaving bare numbers. See the Rating Scale entry in the Question Types Reference Guide for the full field list, including what it does and doesn't support (it takes AI Follow-up, for instance, which can be a genuinely useful way to ask "why" immediately after a low score rather than only finding out in a separate open-ended question later in the survey).
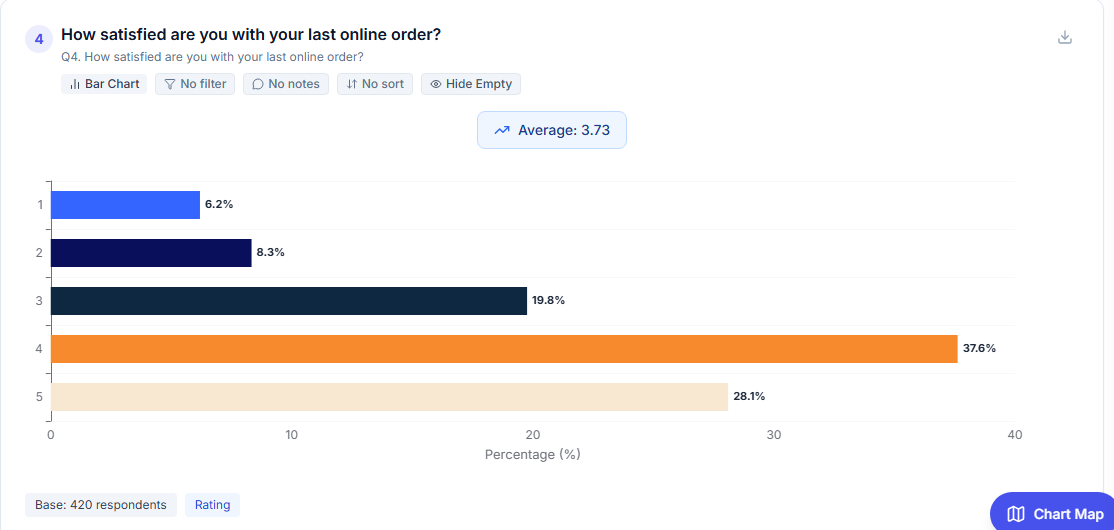
A Rating Scale question's results: the full distribution, not just the single averaged number.
Reading Your Results
Whichever one you run, read the full distribution behind the score before trusting the single summary number - an average or a top-box percentage can hide real polarization, the same way it does for any scale-based question. See Interpreting NPS and Scale Question Results for why the distribution matters more than the headline figure, and NPS Analysis: Beyond the Score specifically for turning a moving NPS number into something you can actually act on rather than just watch.
FAQ
Can I run NPS, CSAT, and CES in the same survey?
Yes, but they usually work best asked about different moments rather than all three about the same interaction - see Choosing Between Them above.
What's a "good" score for any of these?
It varies enormously by industry and audience for all three - comparing your own score over time is generally more useful than comparing against a published external benchmark that may not reflect your specific context. See our industry-by-industry metrics guide for the closest thing to real benchmark figures, where they exist for your field.
Does my field have a better option than these three?
Possibly - employee engagement, healthcare, education, and a few other fields have their own validated, field-specific instruments that tend to outperform a generic metric built for a commercial customer relationship. See Survey Metrics by Industry: What Different Fields Actually Measure for what exists and when it's worth the extra setup.
Should I always use the exact standard wording?
For CES specifically, yes if you want the predictive strength the original research found - the tested wording measurably outperformed alternatives. For NPS and CSAT, the standard wording is still worth defaulting to if you want genuine comparability over time or against external benchmarks, even though both have more room for reasonable phrasing variation than CES does.
Is a 1-10 CSAT scale wrong?
Not wrong, but worth being consistent about - CSAT doesn't have one fixed scale the way NPS's 0-10 or CES's standard wording do, so whichever scale you pick, keep it the same across waves if you want your own trend to stay comparable over time.
Ready to set one up? Head to your survey and add a Rating Scale question - see the Question Types Reference Guide for the full field list.