
Introduction to Shelf Test
Ask someone which of three packaging designs they like best and you'll get a considered answer. In a store, people don't shop that way. They see a row of options at once, glance across them, and reach for the one that caught their eye. Shelf Test is built around that moment: several options side by side, and a record of which ones people pick.
What It Actually Is
Shelf Test is a section type inside an Advanced Survey, alongside Stimuli Testing, Pairwise Comparison, Sequence Flow, and First-Click Test. You attach a pool of two to eight images to the section. A respondent sees the whole pool at once, laid out as a grid, and taps the image or images that catch their attention.
Three things set it apart from a plain multiple-choice question with pictures:
- The grid is shuffled for each respondent. The image in the top-left corner can change from one person to the next. Without shuffling, whichever option is shown first could win for no reason other than its position.
- Respondents can change their mind. Tapping a selected image deselects it. Every tap and untap is recorded, so an image someone considered and then rejected still leaves a trace in the data.
- Labels are hidden by default. Each image can carry a label, such as a name or a price, but respondents don't see it unless you turn labels on for the section. The default keeps the reaction visual, which fits most attention questions.
Why the Random Order Matters
Attention is a comparison. An option that looks strong on its own can look weak next to a stronger neighbour, and where someone sees an option in the grid shapes what they notice first. If one design always sits in the first slot, you can't tell whether it won on its merits or on its position.
Shuffling for each respondent tends to spread the position effect across the sample, rather than letting one fixed arrangement decide the result. It doesn't remove the effect from any single person's view, and you can't switch it off. It's how the section works.
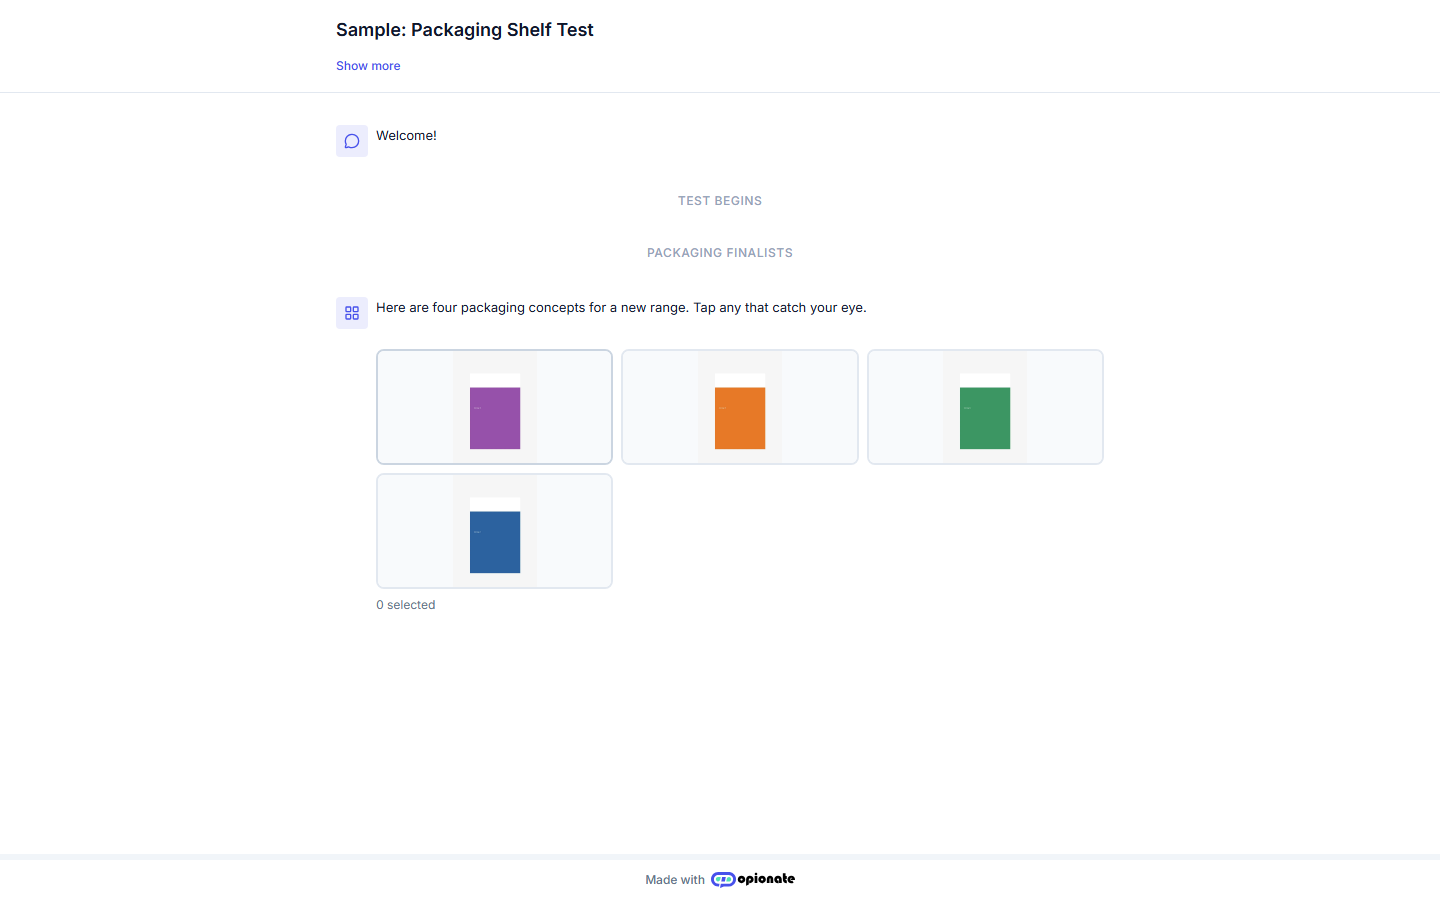
A respondent sees the whole pool at once, with no labels unless you turn them on. The images are sample content.
What Comes Back
The report shows each image as a card above the picks chart, with a thumbnail, so you can read the chart and see the design it refers to. The enlarged view also shows where in the tap sequence people first reached for each image. Both are covered in Reading Shelf Test Results.
What It Doesn't Tell You
A Shelf Test shows which option gets noticed. It doesn't tell you why people noticed it, and it doesn't forecast sales on its own. When you need the reason, add a follow-up question such as "What made you pick that one?" and run the answers through Text Analytics. Treat the picks as a strong input to a decision, not the decision itself.
Where to Go Next
- How to Set Up a Shelf Test Section walks through building one, step by step.
- When to Show Labels in a Shelf Test explains the default and when to change it.
- Choosing Between Survey Section Types helps you pick the right section for your question.